NOTE: This topic is for IELTS Academic Training test ONLY. If you are taking the IELTS General training test then skip this lesson.
Here's a sample Task 1 for you.
Good Luck!
You should spend about 20 minutes on this task.
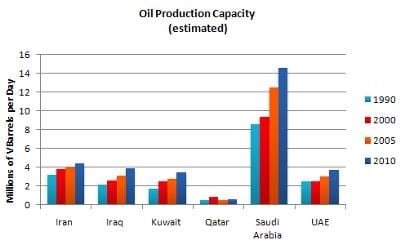
The graph shows oil production capacity for several Gulf countries between 1990 and 2010.
Summarise the information by selecting and reporting the main features, and make comparisons where relevant.
Write a short report for a university lecturer describing the information shown below.
Write at least 150 words.


The graph reflects the amount of Oil produced by the six Gulf countries in 20 years beginning 1990. in a nutshell, there is an increasing trend in the production of Oil in general with exception to Qatar having the lowest rate in contrast to the Saudi Arabia.
fFrstly, in 1990 Saudi Arabia marked the highest production that plays from around 8 Millions of barrel everyday, it showed an increasing trend until year 2000 hitting around 9 million, with dramatic surged marked in 2005 by 12 million until reaching the highest grade at around 15 million. The Iran however, started about 3 million, 3 times higher in Saudi Arabia, UAE at 2.5 million, followed by Iraq and Kuwait at 2 million and 1.8 million respectively. All four Countries presented an upward trend from 1990 to 2010, the UEA however remained dormant during the 1990 and year 2000. in addition their upward improvement remained below 5 million which is 3 folds lower than in Saudi Arabia .
Finally, Qatar exhibits the lowest plateau marked at below 2 million with a small increase in the year 2000.